KEY FINDING: Childhood mortality and undernourishment are both indicators of poverty, but there are variations in how well countries translate resources into good health outcomes.
Generally speaking, national income per capita is a good predictor of family economic well-being, and therefore the wealthier countries in our sample exhibit healthier outcomes related to poverty within families.11 However, family economic well-being also varies with social and cultural factors. Here we map two outcomes that are indicative of material deprivation: childhood mortality and undernourishment in the entire population. While national income levels generally help predict the extent of deprivation in our target countries, there are notable outliers.
CHILDHOOD MORTALITY
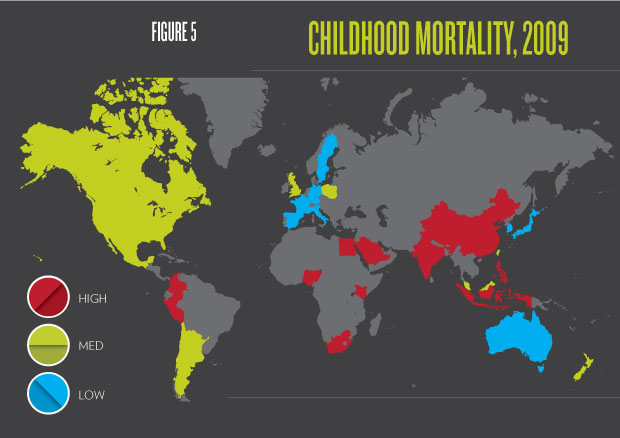
Figure 5indicates that Sweden and Japan share extremely low childhood mortality with a rate of 3 deaths before age five per 1,000 live births (see also Table 4). A lower rate is virtually inconceivable because many infants die in the first minutes of life due to genetic causes. The other East Asian countries and all of our European countries besides Poland have childhood mortality rates of 6 or lower, and Poland’s 7 is still quite respectable given that its national income per capita is less than 60 percent of the next poorest European country in our sample (Italy).12 Canada, Australia, and New Zealand also have childhood mortality of 6 or lower, but the United States does not; despite having higher per capita income than Sweden, its childhood mortality rate is 8. Racial inequality within the United States is the most widely accepted reason for persistently high childhood mortality, as infant deaths among U.S. blacks are more than twice as common as in the white population.13
Childhood death is as rare in Malaysia as it is in the rich industrialized countries at 6 per 1,000 live births. The Philippines and Indonesia have rates in the 30s, much more typical of their income levels. In Latin America, Chile stands as an example of positive deviance with a childhood mortality rate of 9, while other countries in the region range from 14–21. Chile’s advantage could derive from having a greater share of its population living in urban areas and from a low fertility rate correlating with fewer high-risk births. Additionally, the data from Chile support a long-standing theory that high levels of political participation result in better national health care delivery.14
China’s childhood mortality rate of 19 looks very poor within East Asia, but is not at all an outlier given China’s much lower per capita income than its neighbors. In the Middle East, Egypt and Saudi Arabia both have rates of 21. Saudi income levels would predict a single-digit rate, all else being equal; however, distribution of oil wealth is far from equal in Saudi Arabia.
The countries with high childhood mortality rates are South Africa (62), India (66), Kenya (84), and Nigeria (138). South Africa has more than three times the national income per capita that India does, but is one of the highest HIV-prevalent countries in the world. In contrast, even though Kenya suffers more from the HIV/ AIDS epidemic than does Nigeria, Kenya’s childhood mortality rate is lower than Nigeria’s.15 This is largely because Nigeria has comparatively high rates of malaria, inadequate sanitation, and underdeveloped infrastructure.
UNDERNOURISHMENT
Much the same story emerges when the proportion of the population that is undernourished is considered as a measure of poverty instead of the childhood mortality rate, and again the exceptions are the interesting part of the story (see Table 4). The United States is not a negative outlier here; like other wealthy countries, less than 2.5 percent of its population is undernourished. Poland and Malaysia remain positive outliers, though Chile no longer stands out with its 4 percent falling between Argentina’s 3 and Mexico’s 5. The poorest Latin American countries in our sample, Colombia and Peru, have higher rates of undernourishment (12-13 percent). Taiwan seems to have an unusually high rate for its income level at 4 percent, but the actual rate may be 2.5 percent.16 Egypt and Saudi Arabia again come in at the same level (4); this is a success story for Egypt, where income levels more closely resemble its African neighbors than its Middle Eastern neighbors.
Indonesia far outperforms the Philippines on this measure, even though mortality is higher in Indonesia than in the Philippines. Nigeria is not a negative outlier with respect to malnourishment, again pointing to disease rather than poverty alone as the reason for its high childhood mortality. Similarly but even more dramatically, less than 2.5 percent of the South African population is undernourished.
CONCLUSIONS
Both childhood mortality and undernourishment are indicators of poverty, but childhood mortality is more heavily influenced by how well families are able to control infectious disease. There are clearly national-level factors that aid and inhibit family well-being in these two domains. The range of these factors is quite varied, including racial inequality, political participation, income distribution, sanitation, malaria, and HIV/AIDS.
Laurie DeRose is research assistant professor in the Maryland Population Research Center at the University of Maryland, College Park.
PRINT THE PAGE
